I recently revised this spreadsheet tool (Share Price Calculation Spreadsheet : r/MVIS (reddit.com) that I use to calculate my rewards (EPS x # of shares I hold) based on scenarios that I create that mimic Microvision’s 2024-2030 go to market strategies to capture automotive lidar sensor opportunities and now it includes the emerging non-automotive Robotics Lidar opportunities .
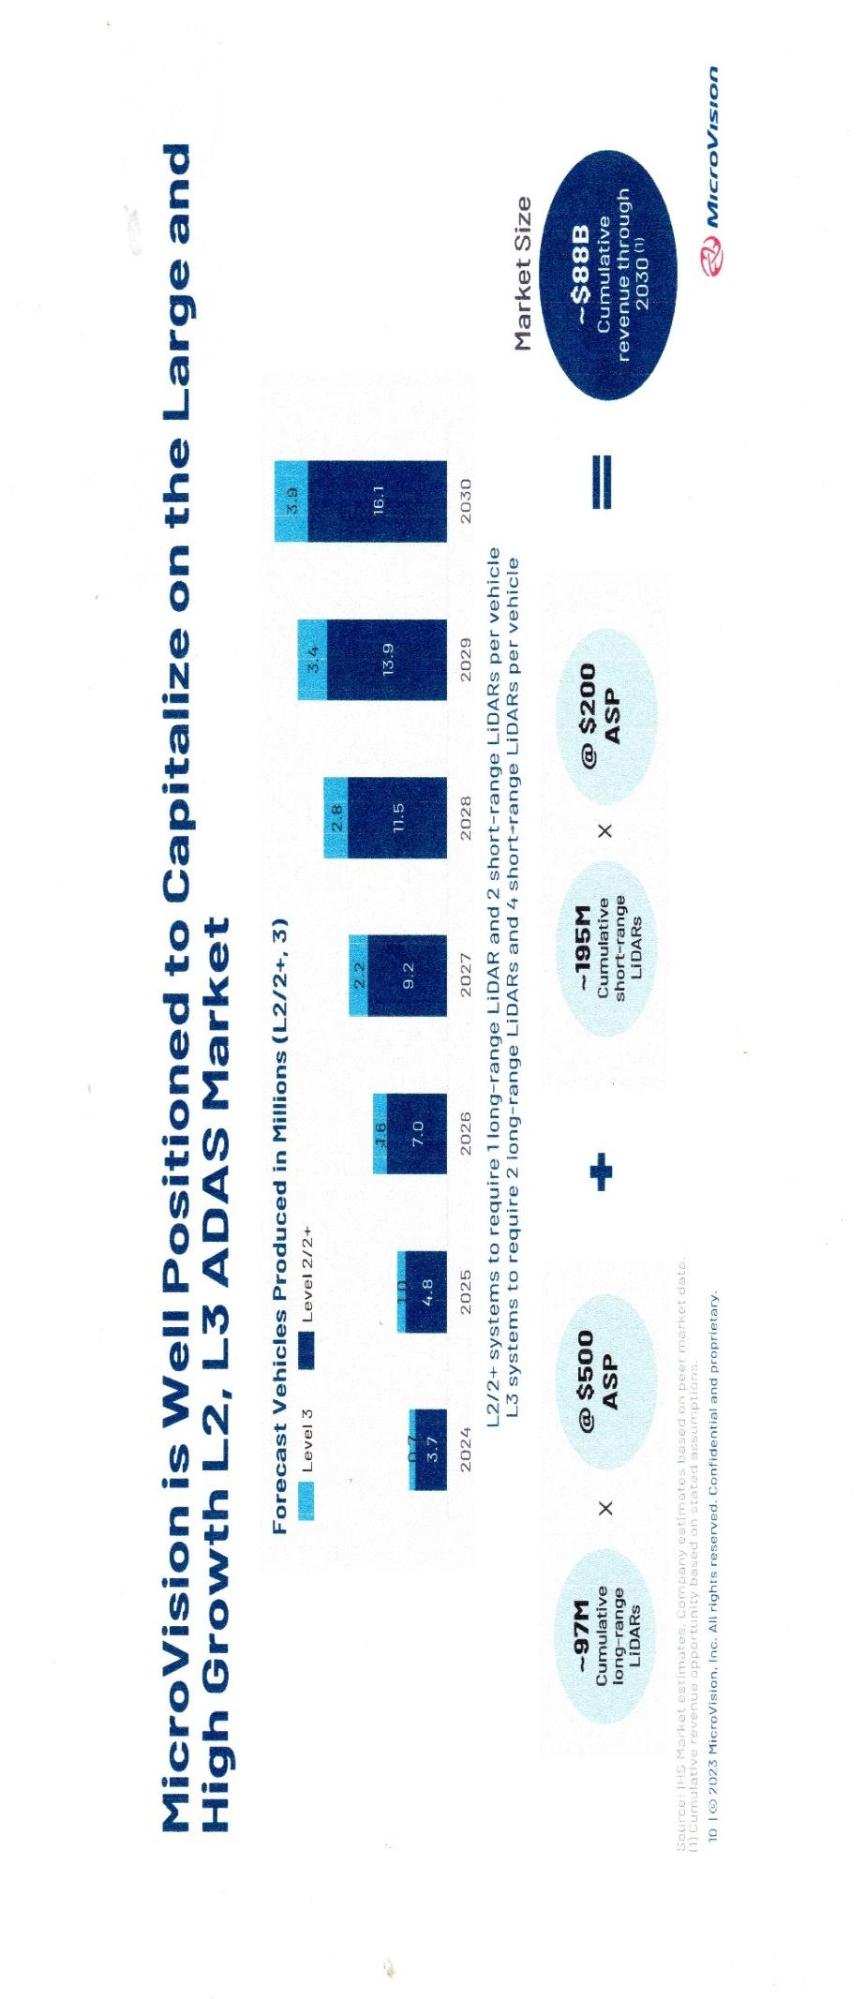
The automotive calculations it performs are still based on the 2024 to 2030 vehicle TAM information given on page 10 of the Investor Presentation package from the 2023 Q4 Earnings report below:
As far as I know Microvision has not publicly released a similar 2024 to 2030 Robotics TAM Lidar forecast for this emerging market so I used the following conservative 2024 – 2030 TAM estimates. I started with a conservative TAM for 2024 of only 100,000 Robots and assumed the TAM would double each year until 2030
2024 - 100,000
2025 – 200,000
2026 – 400,000
2027 – 800,000
2028 – 1,600,000
2029- 3,200,000
2030 – 6,400,000
I also assumed each robot would require one MAVIN at a unit price of $500 each and two MOVIA’s at a unit price of $200 each
One interesting thing I came across recently regarding humanoid robots opportunities was a Lex Fridman interview with Elon Musk about Elon’s Optimus humanoid robot project ….
https://youtu.be/QGjhqFvDpHY?si=ME380hx-PH2ky1R9
During the interview Musk said that he felt the future WW uses for these robots would require the need to produce over 1 billion robots per year!
Maybe that’s why chip companies like NVIDIA with their “best in Class” high speed processors and their AI expertise are starting to focus in on Robotics opportunities for Nvidia’s processor products. I saw one mention on the web that NVIDIA already has created a humanoid robotic “brain” using one of their processors ….
IMO – these humanoid robots will definitely require high speed processors, AI based software, high-resolution cameras and Lidar.
Another big requirement for these humanoid robots is high resolution Gesture Recognition. I don’t know if these humanoid robot’s current camera systems can provide suitable gesture recognition but I believe Microvision’s LBS display technologies has this ability ?….
If Musk’s predicted annual demand for these robots (1 billion per year) ever materializes it will make the vehicle lidar market opportunities for Microvision pale in comparison to the humanoid robotic opportunities for Microvision Lidar and gesture recognizing LBS based technologies..
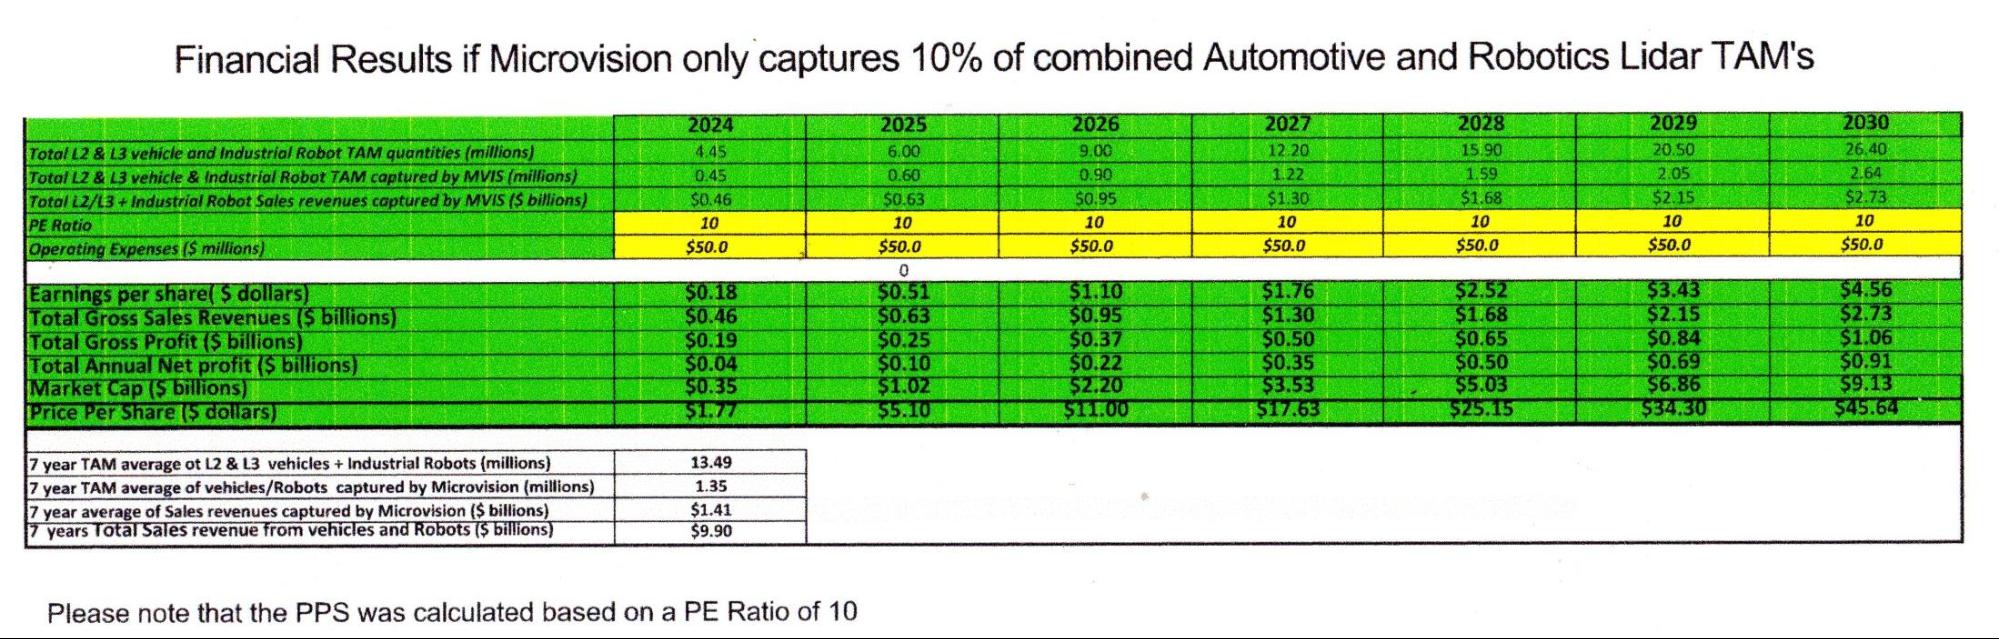
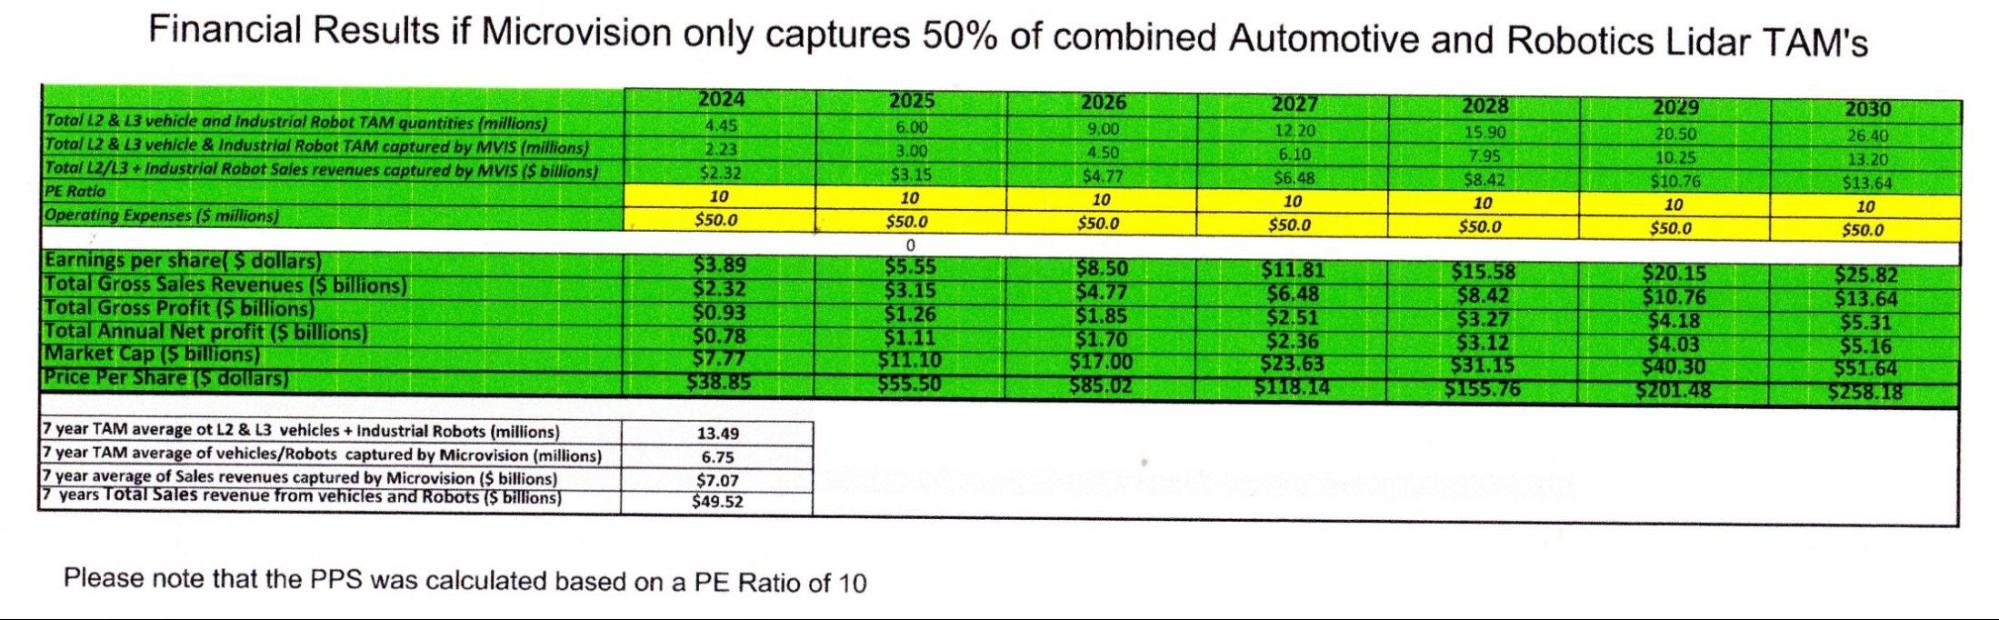
Assuming there are 200 million outstanding shares of Microvision and using a PE ratio of 10 I utilized my revised spreadsheet tool to develop the following tables ,,,
If Microvision’s Lidar products are the “Best in Class” for performance and lowest in cost as Sumit always claims - and Microvision captures a large percentage of the automotive and Robotics TAM’s they are targeting – then IMO the future return for Microvision’s stockholders could be EPIC !! …..
My hope is that this spreadsheet tool will allow MVIS blog members to create their own personal MVIS Automotive and Robotic Lidar Sales scenarios and see what financial rewards it would generate for the stock shares they are holding.
The spreadsheet calculates its financial results from the data you enter in the Yellow Highlighted cells. All its other cells are locked and cannot be accessed and changed.
Here are the parameters you need to assume in your scenarios and enter into the spreadsheet for years 2024 to 2030 to create your own go to market scenario financial results ….:
Percent of Mavin and Movia sale price that covers the manufacturing cost to make each of them (COGS
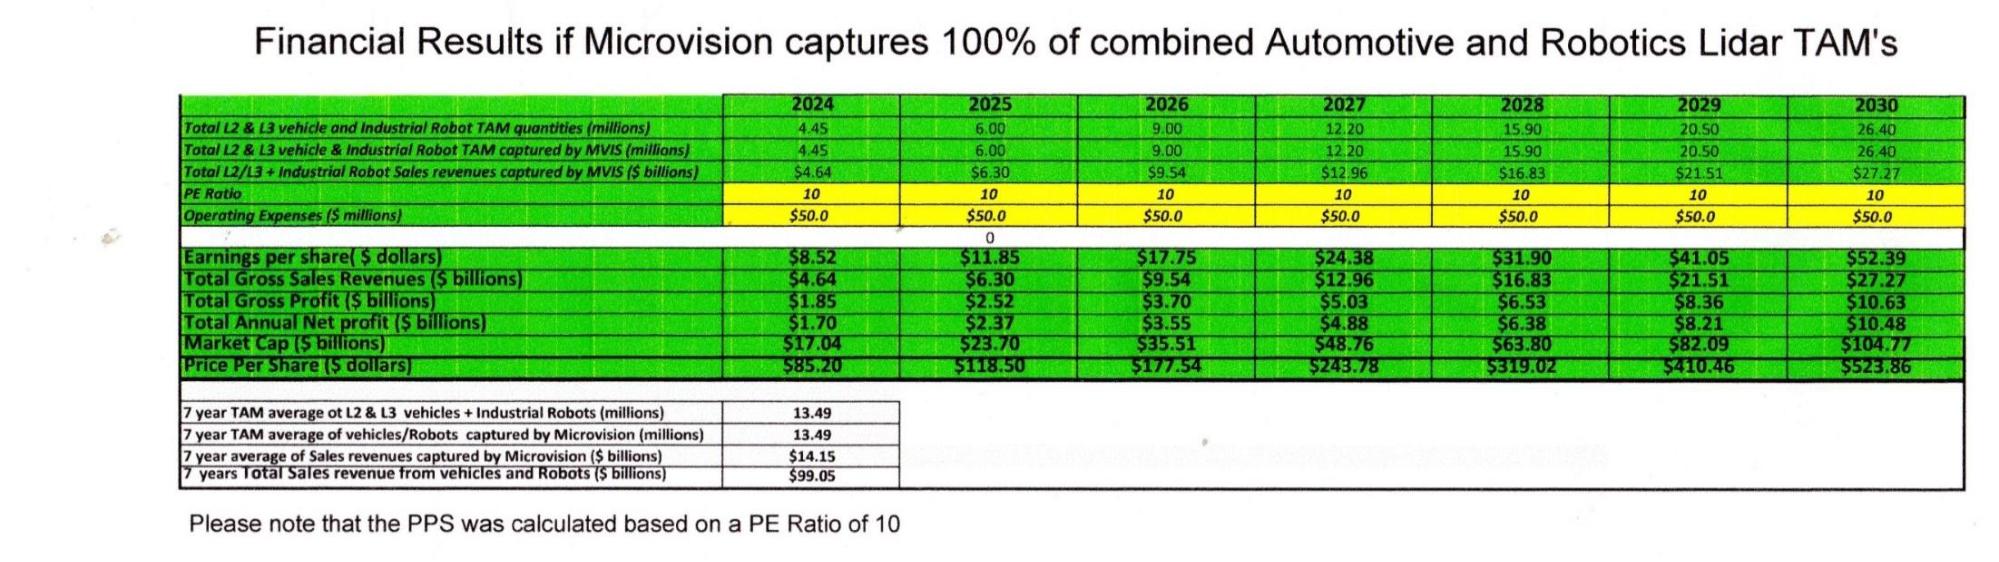
Here’s an example of financial results if Microvision wins all the 2024-2030 vehicle business outlined on page 10 of the 2023 Q4 Earnings CC investor presentation and all of my estimates for Robotics TAM’s using a COGS equal to 60% of sensor’s selling price and assumes a PE Ratio of 10 for each of the 7 years..
If Microvision was to capture all these market opportunities described in the above chart the 7 year cumulative sales revenue would amount to almost $100 Billion !!
It only includes a cumulative 7 year total of 11.26 million robots with the 7 year average robot production being only 1.6 million per year.
That’s about 0.01% of Elon Musk’s estimates of a potential 1 billion robots being produced per year.
I wonder if Jensen Huang (CEO of NVIDIA) knows this?? He definitely seems to be positioning his company to supply processors and associated AI based software for the evolving Robotic opportunities and certainly must know these robots will also need Lidar sensors and gesture recognition sensors.
IMO – with NVIDIA now being one of the top 3 largest companies in the world – it sure would be nice to see them somehow become involved in some sort of significant partnership or other type of relationship with Microvision and its “Best in Class” Lidar products ..
TWT (time will tell) ……
To get started on building your own scenarios just click on the link below and download a copy of the Excel Spreadsheet file to your computer’s hard drive or other storage device and open your stored copy using your MS Excel program. All your data entry goes into the Yellow Highlighted cells…. Any other cell not highlighted in yellow is locked and cannot be changed ….. Have fun creating your own scenarios …….
Here’s the download link: MVIS Lidar Spreadsheet Analysis including autos and industrial robots.xlsx